Shiny apps for creating lake bathymetric maps
In a previous post I showed how to use R for creating bathymetric maps for lakes. To make this process even easier, I have created two apps using Shiny. The maps can be downloaded, opened in Google Earth on both desktop and mobile making it easy to bring along. Try theme out!
Shiny for interactive data exploration
The R Shiny framework is a simple way to turn R analysis or pipelines into interactive web applications. Turning scripts into apps also enables non-R folks perform the same interpolation in user-friendly GUI. To solve the problem of interpolating point measurements of depth to a continuous raster surface, I have build two simple R Shiny apps (hosted at https://www.shinyapps.io/). The workflow for creating such apps is straightforward and many tips and tricks are available from online resources.
TextToSpatial
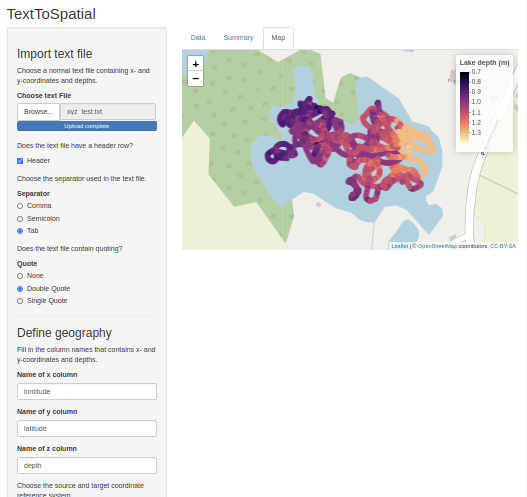
The first app TextToSpatial creates spatial vector files from text files. The georeferenced vector files are required for interpolation but point measurements often come in the form of text files. The app supports text files in different formats, e.g. different delimiter, quoting, headers rows etc. The process is simple, upload the text file, adjust format settings, supply the EPSG code for the coordinate reference system and download the resulting file. Data can be viewed in a table, as a summary and in a interactive Leaflet map.
Screenshot of the TextToSpatial app in action with georeferenced depth measurements from a text file plotted on an interactive map (app source code)
LakeInterpolator
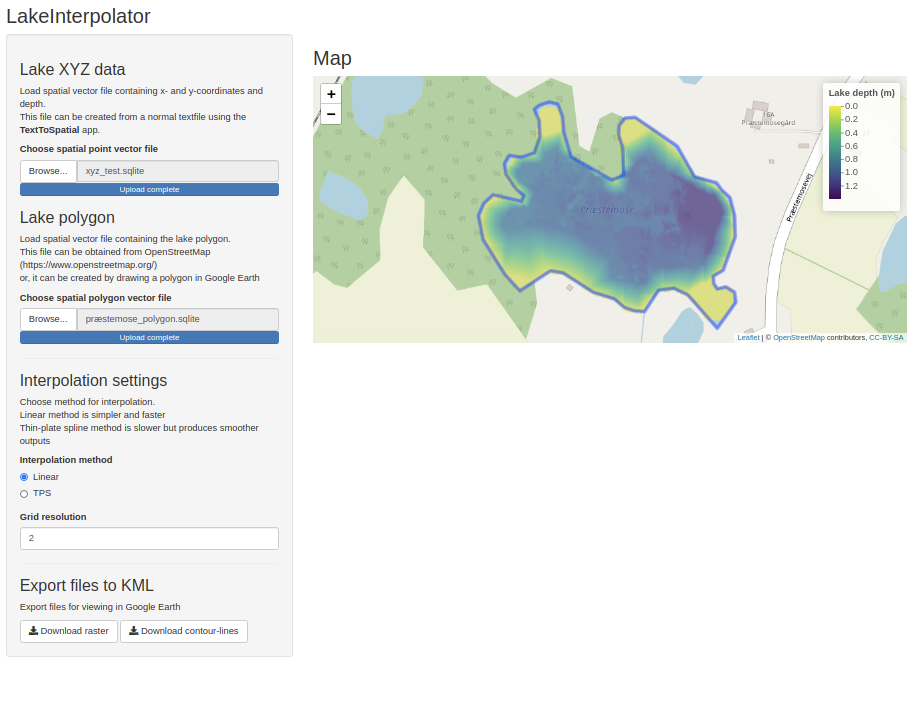
The second app LakeInterpolator uses two input files: a spatial vector point and polygon file. The vector point file contains the depth data and is the output of the TextToSpatial app. The polygon can be retrieved from OpenStreetMap or simply drawn and exported from Google Earth. The polygon is used as a boundary where depth is zero which improved final output. Two interpolation methods are available and resolution of the output raster is defined by the user. The resulting raster and contour-lines can then be downloaded as “.kml/.kmz” files and viewed in Google Earth.
Screenshot of the LakeInterpolator app in action with the interpolated raster surface and lake polygon shown on an interactive map (app source code)
Notes
Simple web applications that looks good by default can be created very rapidly using Shiny. I think that the simplicity is an advantage as it allows for quick development and deployment of apps that can used by everyone. An app should be good for one or a few things only do not try to overload it with functionality for both the sake of the user and developer.
The apps showcased here are prototypes produce the desired output but does not handle wrongful input well yet. I might further develop them, one goal is to enable automatic download of OpenStreetMap polygon data, this way, only an input text is needed to produce nice bathymetric maps. Happy mapping!